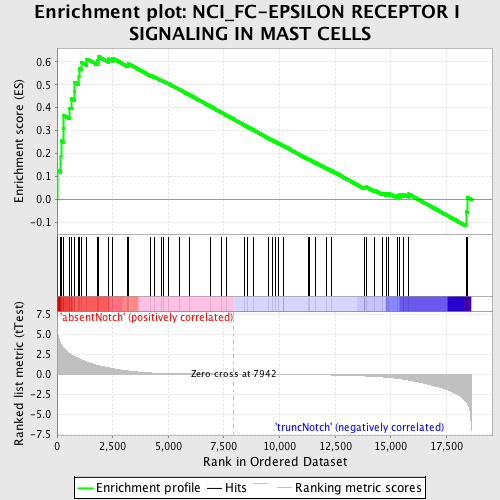
Profile of the Running ES Score & Positions of GeneSet Members on the Rank Ordered List
| Dataset | Set_03_absentNotch_versus_truncNotch.phenotype_absentNotch_versus_truncNotch.cls #absentNotch_versus_truncNotch.phenotype_absentNotch_versus_truncNotch.cls #absentNotch_versus_truncNotch_repos |
| Phenotype | phenotype_absentNotch_versus_truncNotch.cls#absentNotch_versus_truncNotch_repos |
| Upregulated in class | absentNotch |
| GeneSet | NCI_FC-EPSILON RECEPTOR I SIGNALING IN MAST CELLS |
| Enrichment Score (ES) | 0.6215158 |
| Normalized Enrichment Score (NES) | 1.5847157 |
| Nominal p-value | 0.0024213076 |
| FDR q-value | 0.29197386 |
| FWER p-Value | 0.945 |
| PROBE | DESCRIPTION (from dataset) | GENE SYMBOL | GENE_TITLE | RANK IN GENE LIST | RANK METRIC SCORE | RUNNING ES | CORE ENRICHMENT | |
|---|---|---|---|---|---|---|---|---|
| 1 | PTK2 | 1780148 | 1 | 6.937 | 0.1270 | Yes | ||
| 2 | CHUK | 7050736 | 173 | 3.743 | 0.1864 | Yes | ||
| 3 | MAP2K4 | 5130133 | 175 | 3.735 | 0.2548 | Yes | ||
| 4 | ITK | 2230592 | 296 | 3.240 | 0.3077 | Yes | ||
| 5 | MAP3K1 | 5360347 | 305 | 3.211 | 0.3661 | Yes | ||
| 6 | MAPK8 | 2640195 | 574 | 2.526 | 0.3979 | Yes | ||
| 7 | PAK2 | 360438 7050068 | 640 | 2.411 | 0.4386 | Yes | ||
| 8 | RAF1 | 1770600 | 782 | 2.195 | 0.4712 | Yes | ||
| 9 | RASA1 | 1240315 | 794 | 2.176 | 0.5105 | Yes | ||
| 10 | GRB2 | 6650398 | 982 | 1.909 | 0.5354 | Yes | ||
| 11 | FCGR2B | 780750 | 984 | 1.907 | 0.5703 | Yes | ||
| 12 | CBL | 6380068 | 1079 | 1.799 | 0.5982 | Yes | ||
| 13 | WIPF1 | 1170577 | 1339 | 1.514 | 0.6119 | Yes | ||
| 14 | BTK | 3130044 | 1814 | 1.068 | 0.6060 | Yes | ||
| 15 | MAPK1 | 3190193 6200253 | 1876 | 1.029 | 0.6215 | Yes | ||
| 16 | IKBKB | 6840072 | 2316 | 0.784 | 0.6122 | No | ||
| 17 | MAP2K1 | 840739 | 2487 | 0.683 | 0.6156 | No | ||
| 18 | SHC1 | 2900731 3170504 6520537 | 3176 | 0.398 | 0.5858 | No | ||
| 19 | MAP2K2 | 4590601 | 3199 | 0.392 | 0.5918 | No | ||
| 20 | DUSP1 | 6860121 | 4217 | 0.144 | 0.5397 | No | ||
| 21 | LCP2 | 2680066 6650707 | 4376 | 0.126 | 0.5335 | No | ||
| 22 | PLCG1 | 6020369 | 4678 | 0.098 | 0.5190 | No | ||
| 23 | FYN | 2100468 4760520 4850687 | 4785 | 0.091 | 0.5150 | No | ||
| 24 | JUN | 840170 | 4993 | 0.077 | 0.5052 | No | ||
| 25 | PLA2G4A | 6380364 | 5479 | 0.056 | 0.4801 | No | ||
| 26 | PIK3CA | 6220129 | 5960 | 0.041 | 0.4550 | No | ||
| 27 | SYK | 6940133 | 6907 | 0.018 | 0.4044 | No | ||
| 28 | AKT1 | 5290746 | 7382 | 0.010 | 0.3790 | No | ||
| 29 | PTPN11 | 2230100 2470180 6100528 | 7629 | 0.005 | 0.3659 | No | ||
| 30 | NFATC2 | 70450 540097 | 8402 | -0.008 | 0.3244 | No | ||
| 31 | MS4A2 | 2940594 | 8576 | -0.010 | 0.3153 | No | ||
| 32 | LYN | 6040600 | 8816 | -0.015 | 0.3027 | No | ||
| 33 | MAP2K7 | 2260086 | 9480 | -0.026 | 0.2674 | No | ||
| 34 | PLD2 | 2850097 | 9682 | -0.030 | 0.2571 | No | ||
| 35 | GAB2 | 1410280 2340520 4280040 | 9815 | -0.033 | 0.2506 | No | ||
| 36 | PIK3R1 | 4730671 | 9937 | -0.035 | 0.2448 | No | ||
| 37 | VAV1 | 6020487 | 10174 | -0.041 | 0.2328 | No | ||
| 38 | FCER1G | 5550020 | 10190 | -0.041 | 0.2327 | No | ||
| 39 | FCER1A | 1050671 | 11311 | -0.068 | 0.1736 | No | ||
| 40 | DOK1 | 1050279 2680112 5220273 | 11334 | -0.069 | 0.1737 | No | ||
| 41 | IKBKG | 3450092 3840377 6590592 | 11627 | -0.078 | 0.1594 | No | ||
| 42 | SOS1 | 7050338 | 12089 | -0.096 | 0.1363 | No | ||
| 43 | SPHK1 | 2470113 4230398 6220397 | 12336 | -0.109 | 0.1251 | No | ||
| 44 | PLA2G1B | 460500 | 13813 | -0.229 | 0.0498 | No | ||
| 45 | PTPN13 | 2060681 | 13828 | -0.231 | 0.0533 | No | ||
| 46 | FOS | 1850315 | 13888 | -0.238 | 0.0544 | No | ||
| 47 | PXN | 3290048 6400132 | 14255 | -0.291 | 0.0400 | No | ||
| 48 | LAT2 | 5340440 | 14622 | -0.354 | 0.0268 | No | ||
| 49 | CBLB | 3520465 4670348 | 14787 | -0.390 | 0.0251 | No | ||
| 50 | HCLS1 | 7100309 | 14907 | -0.415 | 0.0263 | No | ||
| 51 | LAT | 3170025 | 15281 | -0.527 | 0.0159 | No | ||
| 52 | NFKB1 | 5420358 | 15387 | -0.564 | 0.0205 | No | ||
| 53 | PPAP2A | 1170397 3440288 3930270 | 15553 | -0.624 | 0.0231 | No | ||
| 54 | RELA | 3830075 | 15789 | -0.731 | 0.0238 | No | ||
| 55 | MAPK3 | 580161 4780035 | 18380 | -3.390 | -0.0536 | No | ||
| 56 | HRAS | 1980551 | 18441 | -3.618 | 0.0094 | No |

